Сурет:White noise spectrum.png
Навигацияға өту
Іздеуге өту
Жоғарырақ ажыратымдылық жоқ.
White_noise_spectrum.png (800 × 600 пиксел, файл өлшемі: 5 КБ, MIME түрі: image/png)
| Бұл файл Wikimedia Commons? жобасынан, сондықтан басқа жобаларда да қолдануы мүмкін. Commons ашық лицензиялы медиа файл қоры. Сіз жобаға көмектесе аласыз. |
Ортаққордан қарау |
Түйін
| Сипаттамасы |
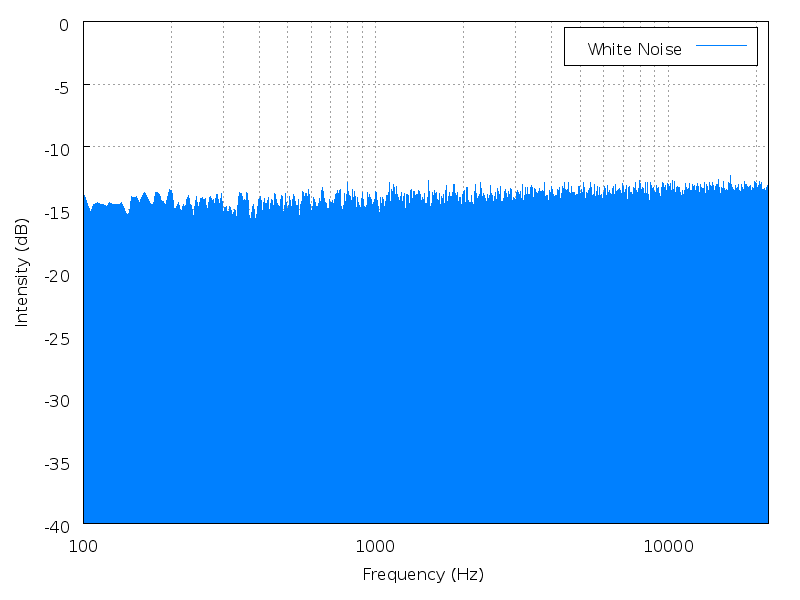
English: Spectrum analysis of uncompressed source for 10 seconds of white noise. Note the logarithmic frequency scale.
The analysis was done using Audacity, and plotting with gnuplot. Transparency was touched up in GIMP to make the graph background pure white. (I find the log frequency plot here confusing, as it suggests that white noise may rise slightly with increasing frequency. A linear frequency scale would be better. However, for comparison with pink noise, having the log frequency plot keeps the frequency axis on both the same.) |
|||
| Күні | ||||
| Көзі | Өзімнің туындым | |||
| Авторы | Javg (талқылау · үлесі) | |||
| Басқа нұсқалары |
|


Instructions
Obtain the frequency analysis from Audacity, set the maximum number of windows, and use a Hamming window. The following script was used to generate the image:
Лицензиялау
| I, the copyright holder of this work, release this work into the public domain. This applies worldwide. In some countries this may not be legally possible; if so: I grant anyone the right to use this work for any purpose, without any conditions, unless such conditions are required by law. |
Файл тарихы
Файл сол кезде қалай көрінгенін көру үшін күн/уақыт дегенге басыңыз.
| Күн/Уақыт | Нобай | Өлшемдер | Қатысушы | Пікір | |
|---|---|---|---|---|---|
| қазіргі | 17:54, 2006 ж. қарашаның 26 | | 800 × 600 (5 КБ) | Javg | == Summary == Spectrum analysis of uncompressed source for {{Audio|White noise.ogg|10 seconds of white noise}}. Note the logarithmic frequency scale. The analysis was done using Audacity, and plotting with gnuplot. Transparency was touched up in |
Файл қолданылуы
Бұл файлды мына бет қолданады:
Глобалды файл қолданылуы
Бұл файл келесі басқа уикилерде қолданылады:
- ast.wikipedia.org жобасында қолданылуы
- bg.wikipedia.org жобасында қолданылуы
- cs.wikipedia.org жобасында қолданылуы
- cv.wikipedia.org жобасында қолданылуы
- en.wikipedia.org жобасында қолданылуы
- eo.wikipedia.org жобасында қолданылуы
- es.wikipedia.org жобасында қолданылуы
- fr.wikipedia.org жобасында қолданылуы
- hu.wikipedia.org жобасында қолданылуы
- hy.wikipedia.org жобасында қолданылуы
- ja.wikipedia.org жобасында қолданылуы
- lt.wikipedia.org жобасында қолданылуы
- ru.wikipedia.org жобасында қолданылуы
- uk.wikipedia.org жобасында қолданылуы
- uz.wikipedia.org жобасында қолданылуы
- zh.wikipedia.org жобасында қолданылуы