Сурет:Dewpoint.jpg
Навигацияға өту
Іздеуге өту
Жоғарырақ ажыратымдылық жоқ.
Dewpoint.jpg (400 × 400 пиксел, файл өлшемі: 28 КБ, MIME түрі: image/jpeg)
| Бұл файл Wikimedia Commons? жобасынан, сондықтан басқа жобаларда да қолдануы мүмкін. Commons ашық лицензиялы медиа файл қоры. Сіз жобаға көмектесе аласыз. |
Ортаққордан қарау |
Түйін
| Сипаттамасы |
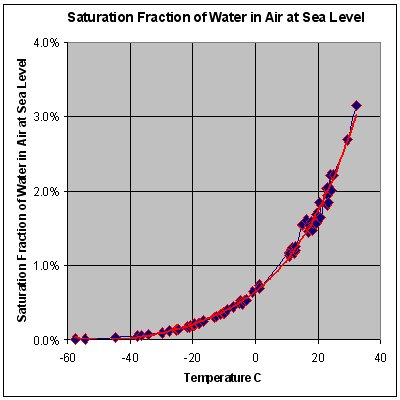
English: Graph of atmospheric dewpoints across a range of temperatures. It was created on August 1, 2004 based on data from the NOAA weather balloon sounding database. |
| Күні | |
| Көзі | Өзімнің туындым (Transferred from en.wikipedia to Commons by Teratornis using CommonsHelper.) |
| Авторы | GregBenson at ағылшын тілі Уикипедия |


Лицензиялау
GregBenson from en.wikipedia.org, the copyright holder of this work, hereby publishes it under the following license:
| Бұл файл Creative Commons Attribution-Share Alike 3.0 Unported лицензиясы бойынша қолжетімді. Subject to disclaimers. | ||
| Атрибуция: GregBenson from en.wikipedia.org | ||
| ||
| Лицензияландырудың бұл қасиеті осы файлға GFDL лицензиясының жаңартылуының бір бөлігі ретінде енгізілген. |

|
Бұл файлды GNU Free Documentation License лицензиясының 1.2 нұсқасы бойынша немесе ескі Ашық бағдарламалық жасақтаушы қорымен жарияланған нұсқасының шарттарына сәйкес көшірмесін алуға, таратуға және/немесе өзгертуге болады. Лицензия көшірмесі GNU Free Documentation License деп аталынған бөлімде көрсетілген. Subject to disclaimers. |
Тұпнұсқа жүктеу журналы
The original description page was here. All following user names refer to en.wikipedia.
- 2004-08-01 16:33 GregBenson 400×400× (28715 bytes) Graph of atmospheric dewpoints across a range of temperatures. I am the author of this figure.
Файл тарихы
Файл сол кезде қалай көрінгенін көру үшін күн/уақыт дегенге басыңыз.
| Күн/Уақыт | Нобай | Өлшемдер | Қатысушы | Пікір | |
|---|---|---|---|---|---|
| қазіргі | 12:36, 2009 ж. қазанның 8 | | 400 × 400 (28 КБ) | File Upload Bot (Magnus Manske) | {{BotMoveToCommons|en.wikipedia|year={{subst:CURRENTYEAR}}|month={{subst:CURRENTMONTHNAME}}|day={{subst:CURRENTDAY}}}} {{Information |Description={{en|Graph of atmospheric dewpoints across a range of temperatures. I am the author of this figure. It was |
Файл қолданылуы
Бұл файлды мына бет қолданады:
Глобалды файл қолданылуы
Бұл файл келесі басқа уикилерде қолданылады:
- ar.wikipedia.org жобасында қолданылуы
- ba.wikipedia.org жобасында қолданылуы
- be.wikipedia.org жобасында қолданылуы
- bn.wikipedia.org жобасында қолданылуы
- ca.wikipedia.org жобасында қолданылуы
- cv.wikipedia.org жобасында қолданылуы
- en.wikipedia.org жобасында қолданылуы
- es.wikipedia.org жобасында қолданылуы
- eu.wikipedia.org жобасында қолданылуы
- fr.wikiversity.org жобасында қолданылуы
- hi.wikipedia.org жобасында қолданылуы
- hr.wikipedia.org жобасында қолданылуы
- mk.wikipedia.org жобасында қолданылуы
- pt.wikipedia.org жобасында қолданылуы
- ru.wikipedia.org жобасында қолданылуы
- sc.wikipedia.org жобасында қолданылуы
- sh.wikipedia.org жобасында қолданылуы
- sq.wikipedia.org жобасында қолданылуы
- sr.wikipedia.org жобасында қолданылуы
- tt.wikipedia.org жобасында қолданылуы