Сурет:Grafico 3d x2+xy+y2.png
Навигацияға өту
Іздеуге өту
Жоғарырақ ажыратымдылық жоқ.
Grafico_3d_x2+xy+y2.png (579 × 404 пиксел, файл өлшемі: 142 КБ, MIME түрі: image/png)
| Бұл файл Wikimedia Commons? жобасынан, сондықтан басқа жобаларда да қолдануы мүмкін. Commons ашық лицензиялы медиа файл қоры. Сіз жобаға көмектесе аласыз. |
Ортаққордан қарау |

|
File:Partial func eg.svg is a vector version of this file. It should be used in place of this PNG file when not inferior.
File:Grafico 3d x2+xy+y2.png → File:Partial func eg.svg
For more information, see Help:SVG. |
 |

|
This image is an information graphic created by a computer program from data sets or formulas that have not been fully provided on this page. In order to allow other editors to improve or build such images, and to ensure compliance with free content licenses such as the GFDL, the following should be provided:
|
|
| |
Түйін
| Сипаттамасы |
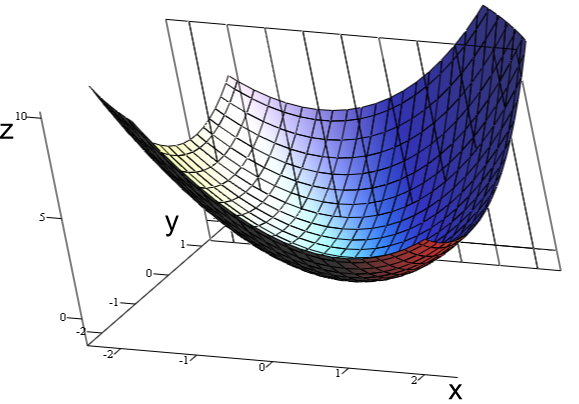
English: Graph of xx+xy+yy=z and y=1 for teaching partial derivatives.
Español: Gráfico de xx+xy+yy=z y y=1 para enseñar derivadas parciales.
Português: Gráfico de xx+xy+yy=z e y=1 para ensinar derivadas parciais.
Polski: Wykres funkcji z=x*x+x*y+y*y |
| Күні | |
| Көзі |
commons Бұл PNG Мәтіндік Mathematica көмегімен жасалған. |
| Авторы | Indeed123 |
| Басқа нұсқалары |
 |
Лицензиялау
Мен бұл туындының авторымын, келесі лицензия аясында бұны жариялаймын:

|
Бұл файлды GNU Free Documentation License лицензиясының 1.2 нұсқасы бойынша немесе ескі Ашық бағдарламалық жасақтаушы қорымен жарияланған нұсқасының шарттарына сәйкес көшірмесін алуға, таратуға және/немесе өзгертуге болады. Лицензия көшірмесі GNU Free Documentation License деп аталынған бөлімде көрсетілген. |
Бұл файл Creative Commons Attribution-Share Alike 3.0 Unported лицензиясы бойынша қолжетімді.
- Сіз келесі әрекеттерге еркінсіз:
- бөлісу – туындыны көшіру, тарату және тапсыру
- мазмұнын өзгерту – туындыны бейімдеу
- Келесі ережелерді сақтағанда:
- атрибуция – Авторлықты белгілеп, лицензияға сілтеме беріп, өзгеріс жасалғанын анықтауыңыз керек. Сіз мұны кез келген орынды жолмен істей аласыз, бірақ лицензиар сізді немесе қолдануыңызды мақұлдайтындай емес.
- бірдей шарттарда тарату – Материалды араластырсаңыз, түрлендірсеңіз немесе құрастырсаңыз, үлестеріңізді түпнұсқамен бірдей бірдей немесе үйлесімді лицензия бойынша таратуыңыз керек.
Өз қалауыңызбен лицензияны таңдауыңызға болады.
Файл тарихы
Файл сол кезде қалай көрінгенін көру үшін күн/уақыт дегенге басыңыз.
| Күн/Уақыт | Нобай | Өлшемдер | Қатысушы | Пікір | |
|---|---|---|---|---|---|
| қазіргі | 04:08, 2008 ж. желтоқсанның 16 | | 579 × 404 (142 КБ) | Usuwiki | {{Information |Description={{en|1=Graph of xx+xy+yy=z and y=1 for teaching partial derivatives.}} {{es|1=Gráfico de xx+xy+yy=z y y=1 para enseñar derivadas parciales.}} |Source=commons |Author=Indeed123 |Date=July 24, 2008 |Permission |
Файл қолданылуы
Бұл файлды мына бет қолданады:
Глобалды файл қолданылуы
Бұл файл келесі басқа уикилерде қолданылады:
- ar.wikipedia.org жобасында қолданылуы
- ast.wikipedia.org жобасында қолданылуы
- ba.wikipedia.org жобасында қолданылуы
- be.wikipedia.org жобасында қолданылуы
- ckb.wikipedia.org жобасында қолданылуы
- cs.wikipedia.org жобасында қолданылуы
- de.wikipedia.org жобасында қолданылуы
- en.wikipedia.org жобасында қолданылуы
- es.wikipedia.org жобасында қолданылуы
- fa.wikipedia.org жобасында қолданылуы
- fi.wikipedia.org жобасында қолданылуы
- gl.wikipedia.org жобасында қолданылуы
- nl.wikipedia.org жобасында қолданылуы
- pl.wikipedia.org жобасында қолданылуы
- pt.wikipedia.org жобасында қолданылуы
- ro.wikipedia.org жобасында қолданылуы
- ru.wikipedia.org жобасында қолданылуы
- sk.wikipedia.org жобасында қолданылуы
- sq.wikipedia.org жобасында қолданылуы
- vi.wikipedia.org жобасында қолданылуы
- zh.wikipedia.org жобасында қолданылуы